Your Numbers Are There. The Answers Should Be Easier to Find.
What You'll See in the Demo
<li class="lpv-ch"><button type="button" class="lpv-ch-btn" data-lpv-gate="chapter-1"><span class="lpv-v lpv-v-shot"><img src="https://cdn.prod.website-files.com/6278fb3bb1164cddc0edd084/6af798df0f216b76102a47e9_01_Work_With_Financial_Data.png" srcset="https://cdn.prod.website-files.com/6278fb3bb1164cddc0edd084/6af798df0f216b76102a47e9_01_Work_With_Financial_Data-p-500.png 500w, https://cdn.prod.website-files.com/6278fb3bb1164cddc0edd084/6af798df0f216b76102a47e9_01_Work_With_Financial_Data-p-800.png 800w, https://cdn.prod.website-files.com/6278fb3bb1164cddc0edd084/6af798df0f216b76102a47e9_01_Work_With_Financial_Data-p-1080.png 1080w, https://cdn.prod.website-files.com/6278fb3bb1164cddc0edd084/6af798df0f216b76102a47e9_01_Work_With_Financial_Data-p-1600.png 1600w" sizes="(max-width: 820px) calc(100vw - 56px), 566px" loading="lazy" alt="Metrics and dimensions behind existing financial reports in Fintastic"></span><span class="lpv-ch-body"><span class="lpv-ch-num">01</span><span class="lpv-ch-title">Get More From the Data You Already Have</span><span class="lpv-ch-text">Explore the metrics and dimensions behind your financial reports without starting from scratch.</span></span></button></li><li class="lpv-ch"><button type="button" class="lpv-ch-btn" data-lpv-gate="chapter-2"><span class="lpv-v lpv-v-shot"><img src="https://cdn.prod.website-files.com/6278fb3bb1164cddc0edd084/6af798df7fdb8e02e8ddd4f6_02_Create_Charts_With_AI.png" srcset="https://cdn.prod.website-files.com/6278fb3bb1164cddc0edd084/6af798df7fdb8e02e8ddd4f6_02_Create_Charts_With_AI-p-500.png 500w, https://cdn.prod.website-files.com/6278fb3bb1164cddc0edd084/6af798df7fdb8e02e8ddd4f6_02_Create_Charts_With_AI-p-800.png 800w, https://cdn.prod.website-files.com/6278fb3bb1164cddc0edd084/6af798df7fdb8e02e8ddd4f6_02_Create_Charts_With_AI-p-1080.png 1080w, https://cdn.prod.website-files.com/6278fb3bb1164cddc0edd084/6af798df7fdb8e02e8ddd4f6_02_Create_Charts_With_AI-p-1600.png 1600w" sizes="(max-width: 820px) calc(100vw - 56px), 566px" loading="lazy" alt="Fintastic AI Agent visualizing revenue by channel from existing data"></span><span class="lpv-ch-body"><span class="lpv-ch-num">02</span><span class="lpv-ch-title">Turn a Question Into a Chart</span><span class="lpv-ch-text">Ask the AI Agent to visualize revenue by channel and see the breakdown using your existing data.</span></span></button></li><li class="lpv-ch"><button type="button" class="lpv-ch-btn" data-lpv-gate="chapter-3"><span class="lpv-v lpv-v-shot"><img src="https://cdn.prod.website-files.com/6278fb3bb1164cddc0edd084/6af798df7d9e99c64a3f7009_03_See_Whats_Driving_Revenue.png" srcset="https://cdn.prod.website-files.com/6278fb3bb1164cddc0edd084/6af798df7d9e99c64a3f7009_03_See_Whats_Driving_Revenue-p-500.png 500w, https://cdn.prod.website-files.com/6278fb3bb1164cddc0edd084/6af798df7d9e99c64a3f7009_03_See_Whats_Driving_Revenue-p-800.png 800w, https://cdn.prod.website-files.com/6278fb3bb1164cddc0edd084/6af798df7d9e99c64a3f7009_03_See_Whats_Driving_Revenue-p-1080.png 1080w, https://cdn.prod.website-files.com/6278fb3bb1164cddc0edd084/6af798df7d9e99c64a3f7009_03_See_Whats_Driving_Revenue-p-1600.png 1600w" sizes="(max-width: 820px) calc(100vw - 56px), 566px" loading="lazy" alt="Revenue movement across channels and periods in Fintastic"></span><span class="lpv-ch-body"><span class="lpv-ch-num">03</span><span class="lpv-ch-title">Understand What's Driving Performance</span><span class="lpv-ch-text">See how revenue changes across channels and periods, and identify what's behind the movement.</span></span></button></li><li class="lpv-ch"><button type="button" class="lpv-ch-btn" data-lpv-gate="chapter-4"><span class="lpv-v lpv-v-shot"><img src="https://cdn.prod.website-files.com/6278fb3bb1164cddc0edd084/6af798df680cd35ce7dc9e58_04_Get_Answers_Beyond_The_Chart.png" srcset="https://cdn.prod.website-files.com/6278fb3bb1164cddc0edd084/6af798df680cd35ce7dc9e58_04_Get_Answers_Beyond_The_Chart-p-500.png 500w, https://cdn.prod.website-files.com/6278fb3bb1164cddc0edd084/6af798df680cd35ce7dc9e58_04_Get_Answers_Beyond_The_Chart-p-800.png 800w, https://cdn.prod.website-files.com/6278fb3bb1164cddc0edd084/6af798df680cd35ce7dc9e58_04_Get_Answers_Beyond_The_Chart-p-1080.png 1080w, https://cdn.prod.website-files.com/6278fb3bb1164cddc0edd084/6af798df680cd35ce7dc9e58_04_Get_Answers_Beyond_The_Chart-p-1600.png 1600w" sizes="(max-width: 820px) calc(100vw - 56px), 566px" loading="lazy" alt="Follow-up questions investigating revenue changes in the same financial data"></span><span class="lpv-ch-body"><span class="lpv-ch-num">04</span><span class="lpv-ch-title">Ask Follow-Up Questions Without Starting Over</span><span class="lpv-ch-text">Go beyond the chart to investigate changes and get explanations from the same financial data.</span></span></button></li>
Stop Searching for Answers in Your Reports.
See how Fintastic can help your team investigate variances, understand performance, and answer business questions faster.
DhRRJDm
https://gofintastic.com/hubfs/Video%20Clips/Fintastic%20Demo%20Clips/Fintastic_Charts_Hero_Preview_NEW.mp4
3 min
4 chapters
dd00ba02-a441-4826-9fd1-1a3eeb48845b
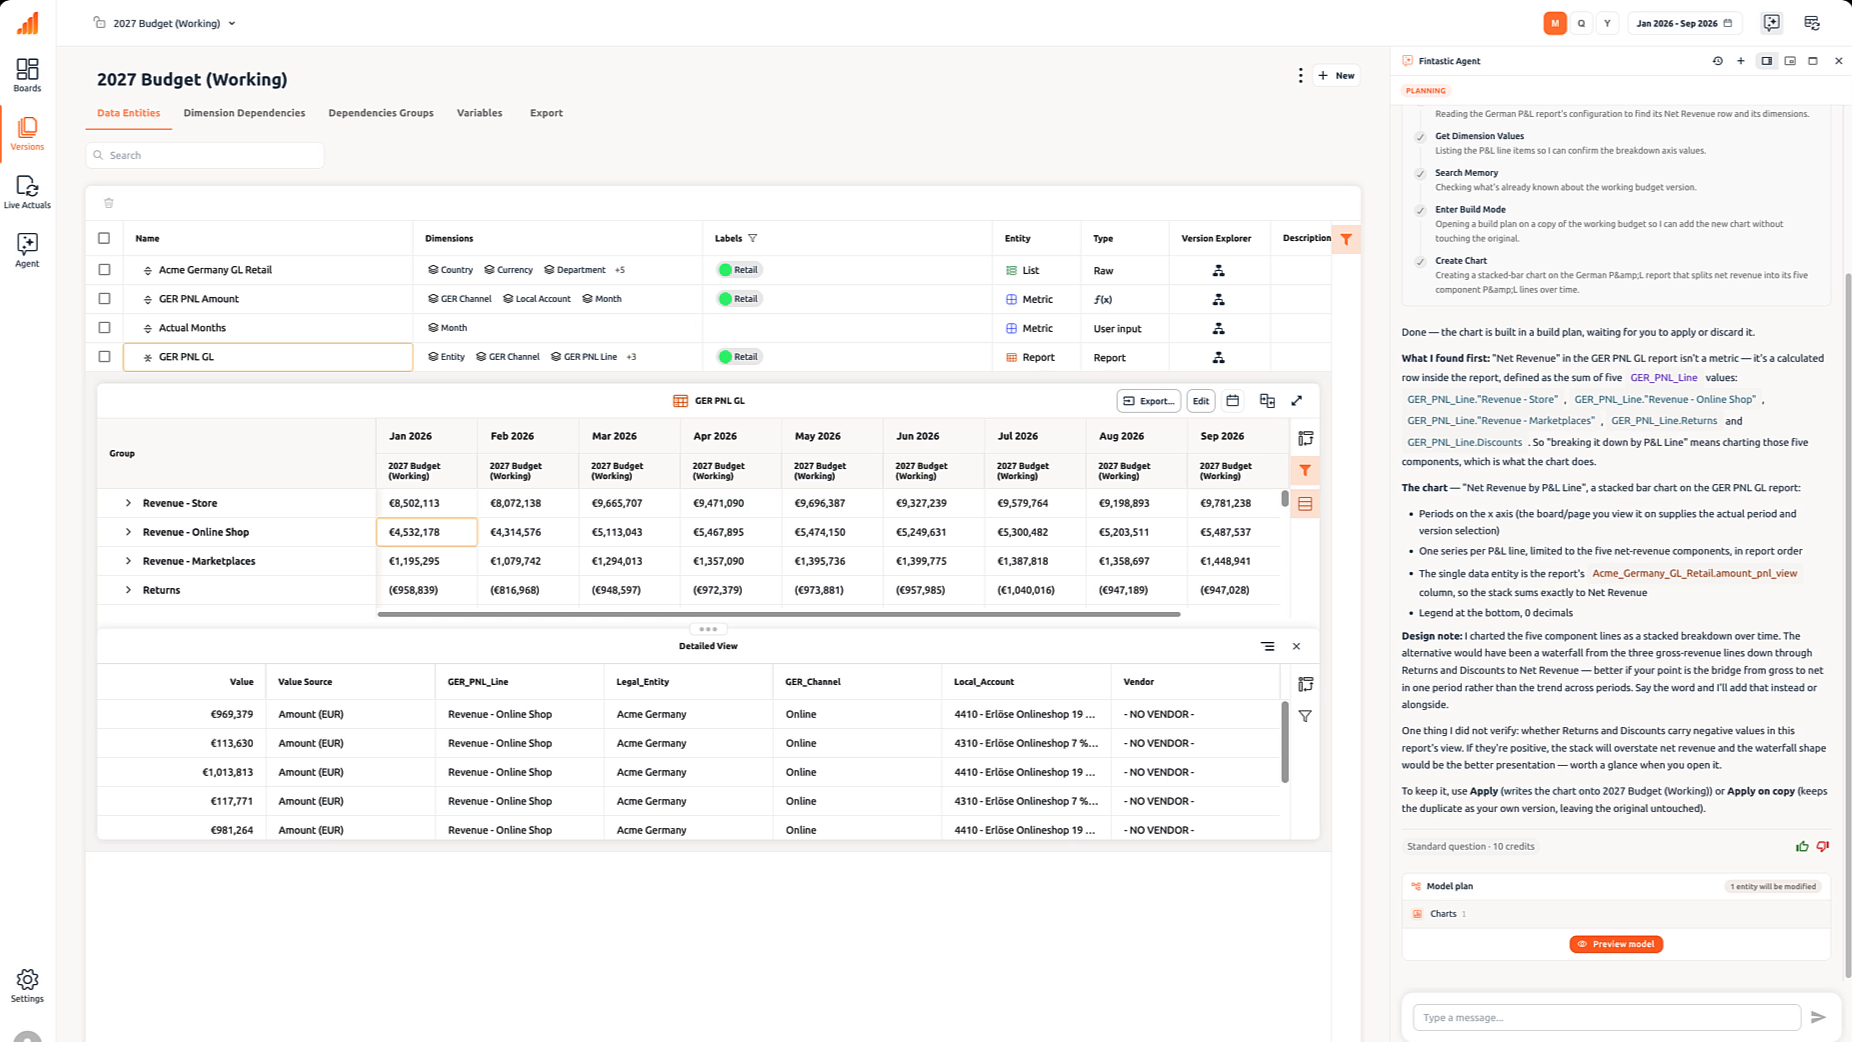
Stop digging through reports to understand what changed. See how Fintastic helps you visualize financial performance, investigate variances, and get answers directly from your data.